Peaks and Reference
For routine work, use Ranges / Multiplet analysis instead of peak picking. Range picking integrates each signal, extracts its multiplicity and coupling constants, and still keeps the underlying peaks. Plain peak picking should normally only be used for peak-shape analysis (deconvolution), described below.
Peak Picking
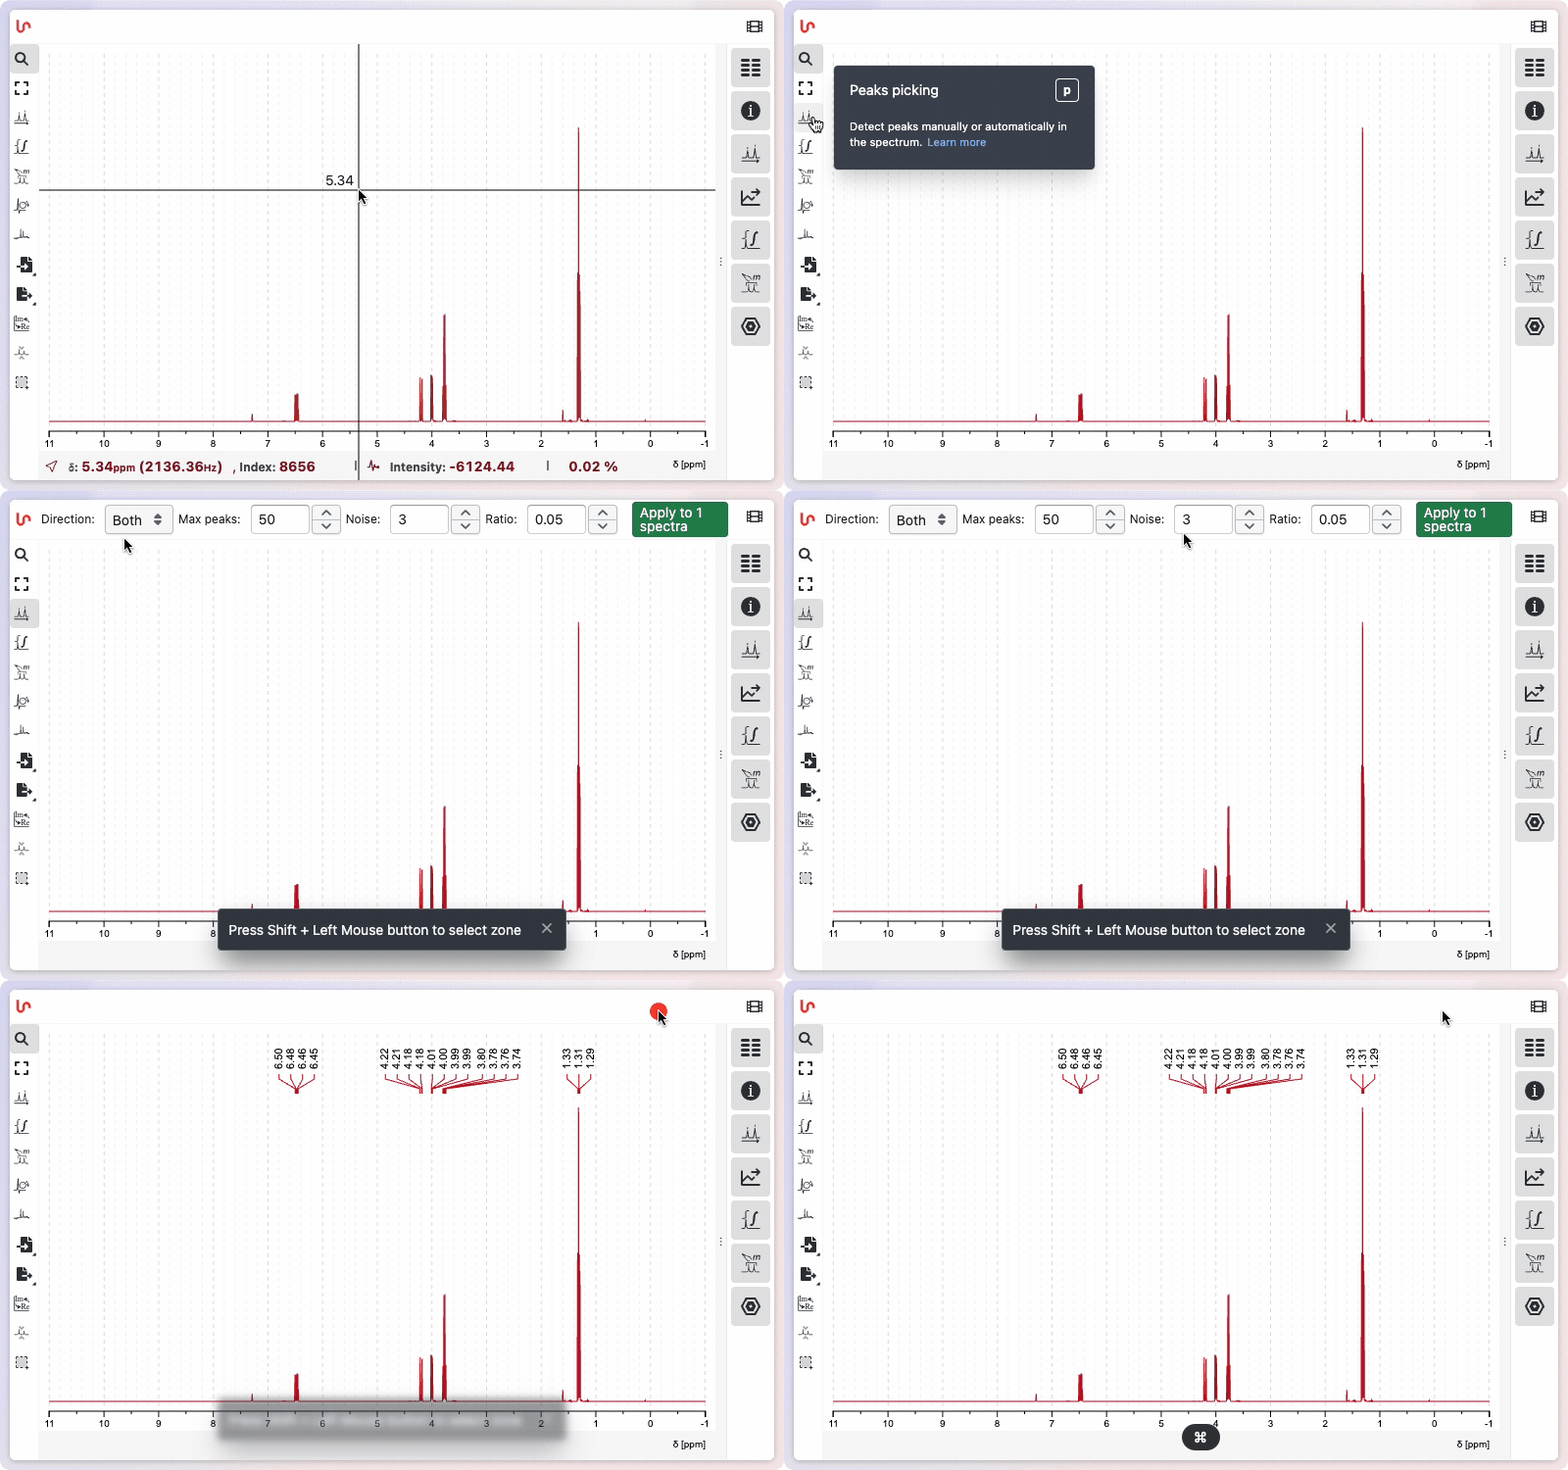
Click the Peaks picking button on the left of the workspace, or press p, to enter peak picking mode. You can then let NMRium detect peaks automatically or add them manually. All picked peaks are listed in the Peaks panel on the right.
With the tool active you add peaks with a plain click or click-drag-release — no Shift needed. This depends on the Invert actions preference; see Tool actions and zoom. The interactions below assume the default setting.
Automatic peak picking
To detect all peaks at once, open the options bar above the workspace and set the detection parameters:
| Option | Meaning |
|---|---|
| Direction | Detect Both, positive, or negative signals |
| Max peaks | Maximum number of peaks to return |
| Noise | Noise factor used to reject small fluctuations |
| Ratio | Minimum relative intensity a peak must reach |
Click Apply to N spectra to run the detection. The same parameters are applied to every displayed spectrum at once — N is the number of spectra currently loaded — so you can peak pick a whole set in a single step. Every detected peak is labelled on its spectrum and added to the Peaks panel. To restrict detection to one region, drag over it first, then apply.
Manual peak picking
With the peak picking tool active you have two ways to add a single peak:
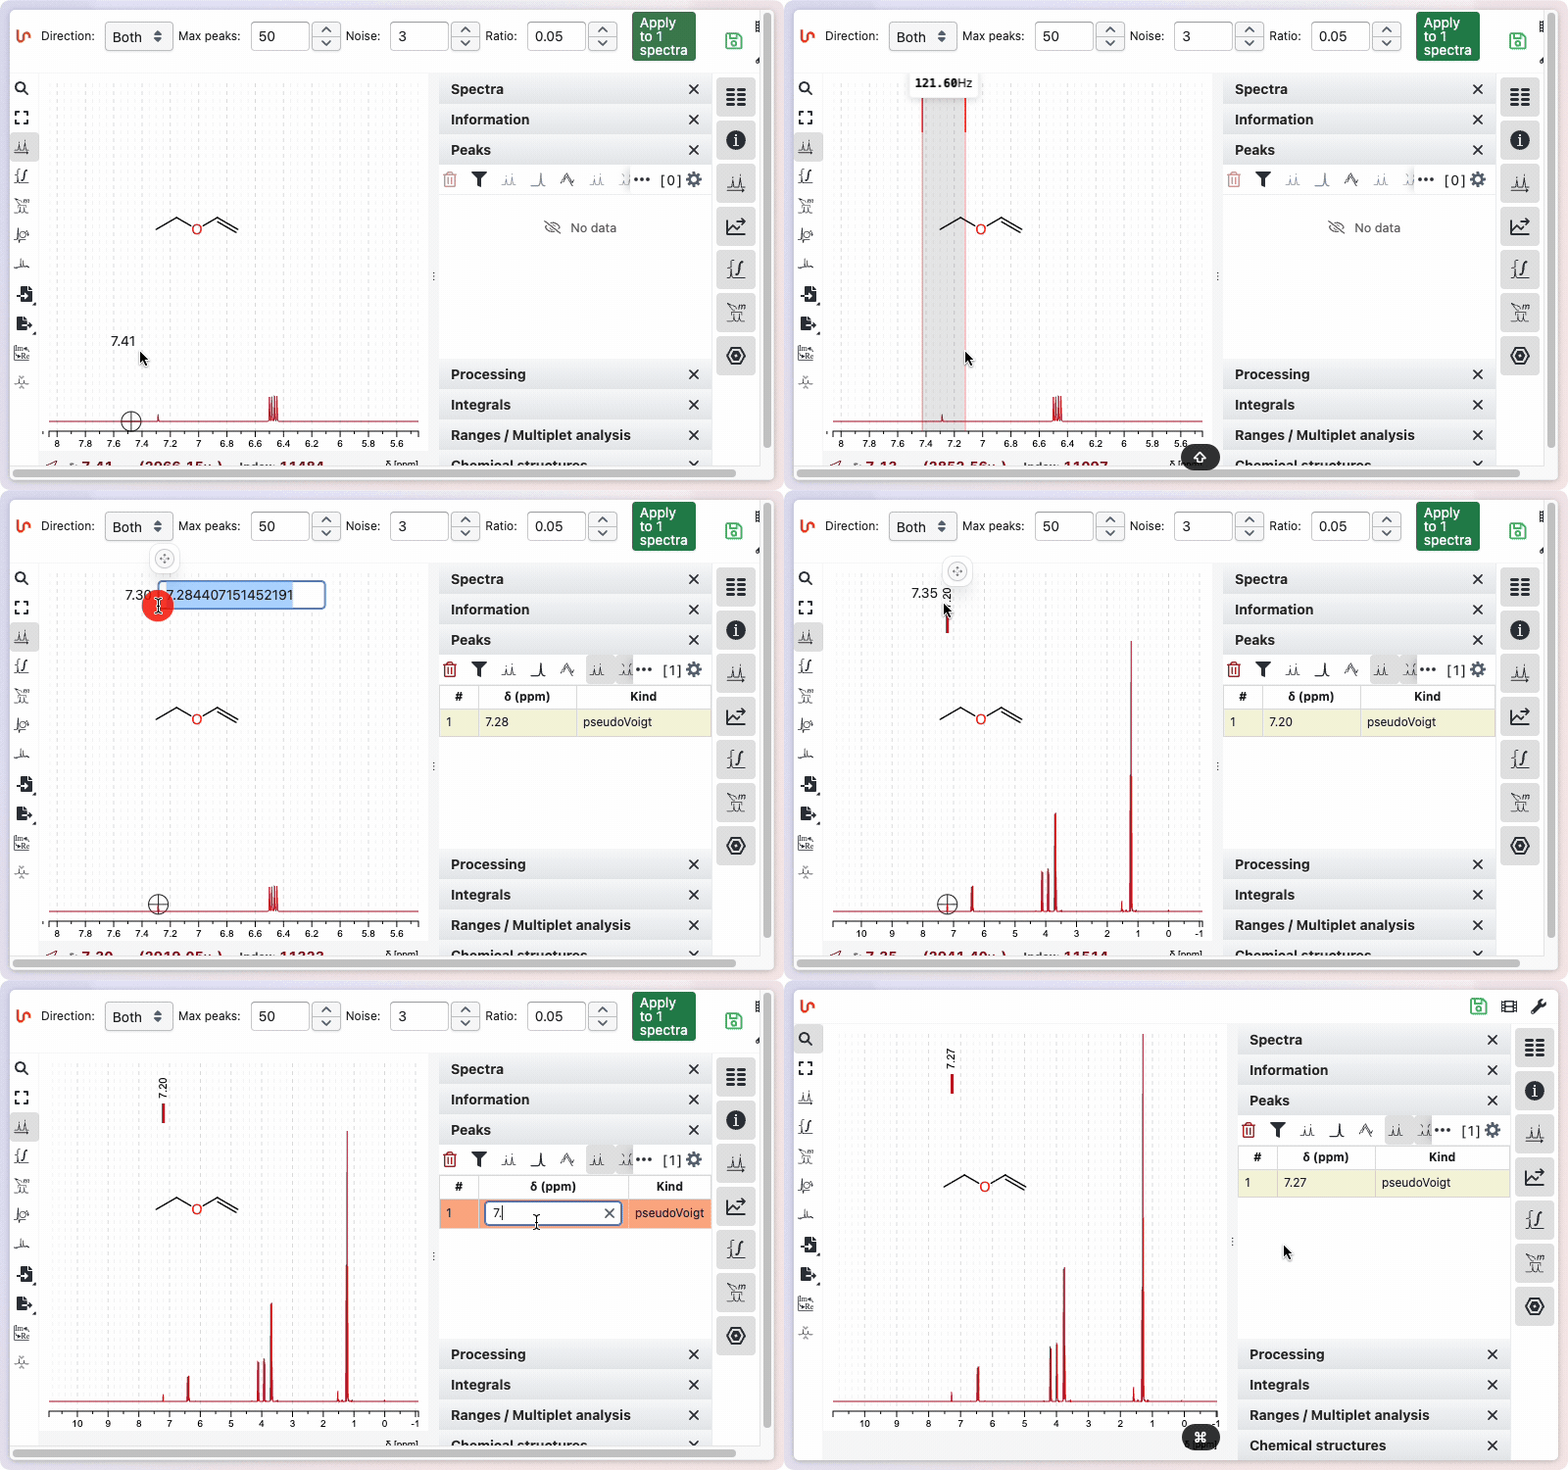
- Click on the spectrum — adds a peak exactly at the pointer position.
- Drag over a range — adds a peak at the maximum found within that range.
As you move the pointer, the current chemical shift is shown above the trace and the live readout at the bottom of the workspace reports the shift in ppm and Hz together with the intensity. Click the ppm value shown next to a peak to edit it — the inline field reveals the chemical shift to full precision.
Panel "Peaks"
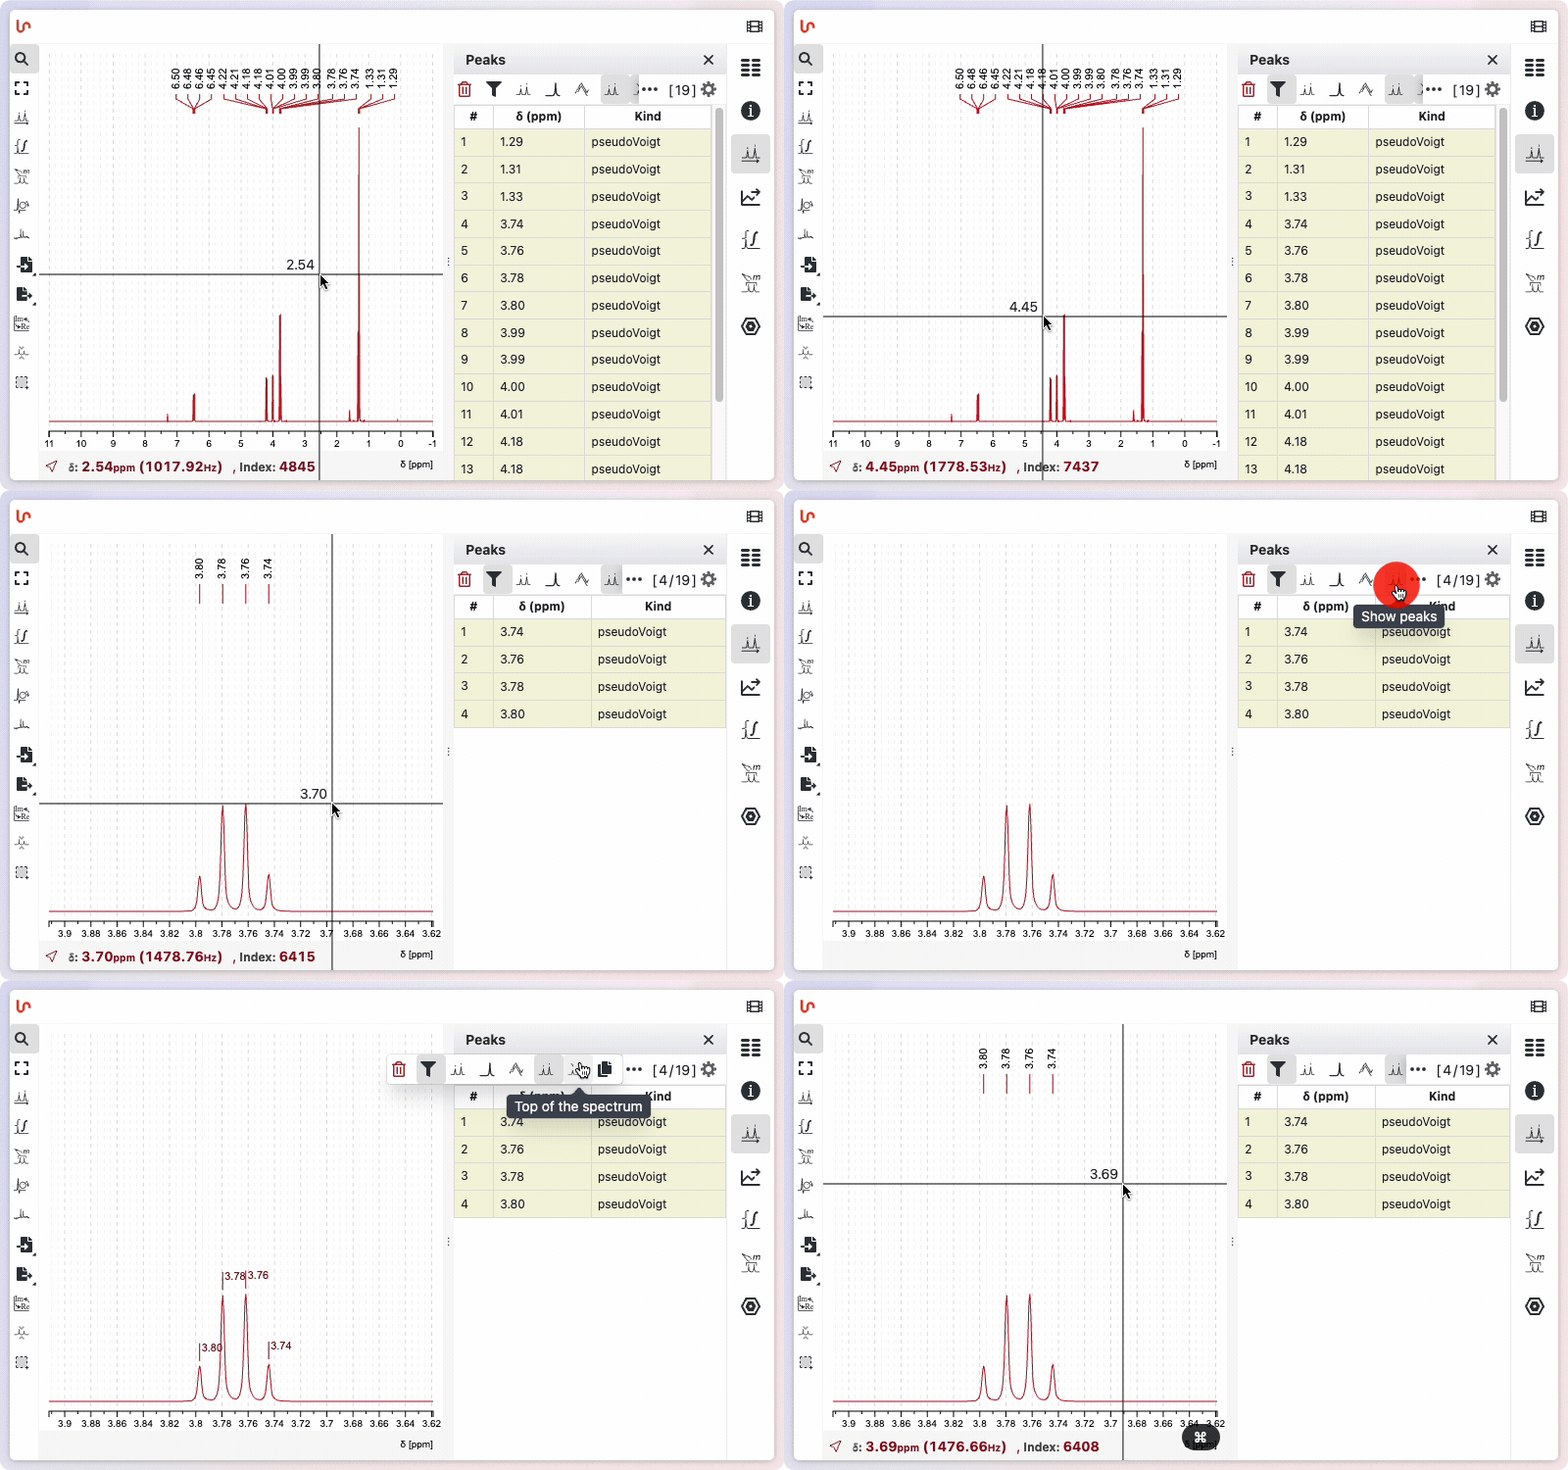
Every picked peak is listed in the Peaks panel with its number, chemical shift δ (ppm) and shape Kind. The toolbar at the top of the panel controls the list and how peaks are drawn, in this order:
| Button | Action |
|---|---|
| Recycle bin | Delete all peaks |
| Funnel | Toggle between all peaks and only those in the displayed region — the counter [ visible / total ] follows |
| Peaks shapes (shape analysis) | Show or hide the individual fitted peak shapes |
| Peaks sum (shape analysis) | Show or hide the reconstructed trace obtained by summing all fitted shapes |
| Optimize peaks (shape analysis) | Fit every peak of the spectrum to the experimental data — see Peak Shapes and Deconvolution below |
| Show / hide peaks | Show or hide the peak markers on the spectrum |
| Top of the spectrum / Top of the peak | Choose where the chemical-shift labels are drawn — aligned near the top of the plot, or just above each peak |
| Copy as TSV | Copy the peak list to the clipboard as tab-separated values |
| Gear | Open the display settings to choose which columns appear (for example the fwhm, mu and area columns) |
The three middle buttons — Peaks shapes, Peaks sum and Optimize peaks — drive the peak-shape analysis (deconvolution) covered in the next section. The fwhm, mu and area values they produce are shown in the panel once you enable those columns from the gear.
Set a Reference
Referencing means giving a known signal its correct chemical shift; the whole spectrum is then shifted accordingly. Pick the solvent or reference signal, then set its value in one of two ways:
- From the label — click the peak's ppm label in the spectrum and type the correct value.
- From the table — double-click the δ (ppm) cell of its row in the Peaks panel and type the correct value.
NMRium recalibrates the spectrum so that peak lands on the value you entered (see the manual peak picking animation above).
You can also set the reference from a range or multiplet — see Set the reference on the Ranges page.
Peak Shapes and Deconvolution
NMRium can deconvolute the spectrum to analyze the shape of each peak. Every peak has a shape Kind — Gaussian, Lorentzian, or pseudo-Voigt (which mixes Gaussian and Lorentzian through the mu factor). Enable the fwhm (width), mu and area columns from the panel settings (gear) to inspect the fitted values.
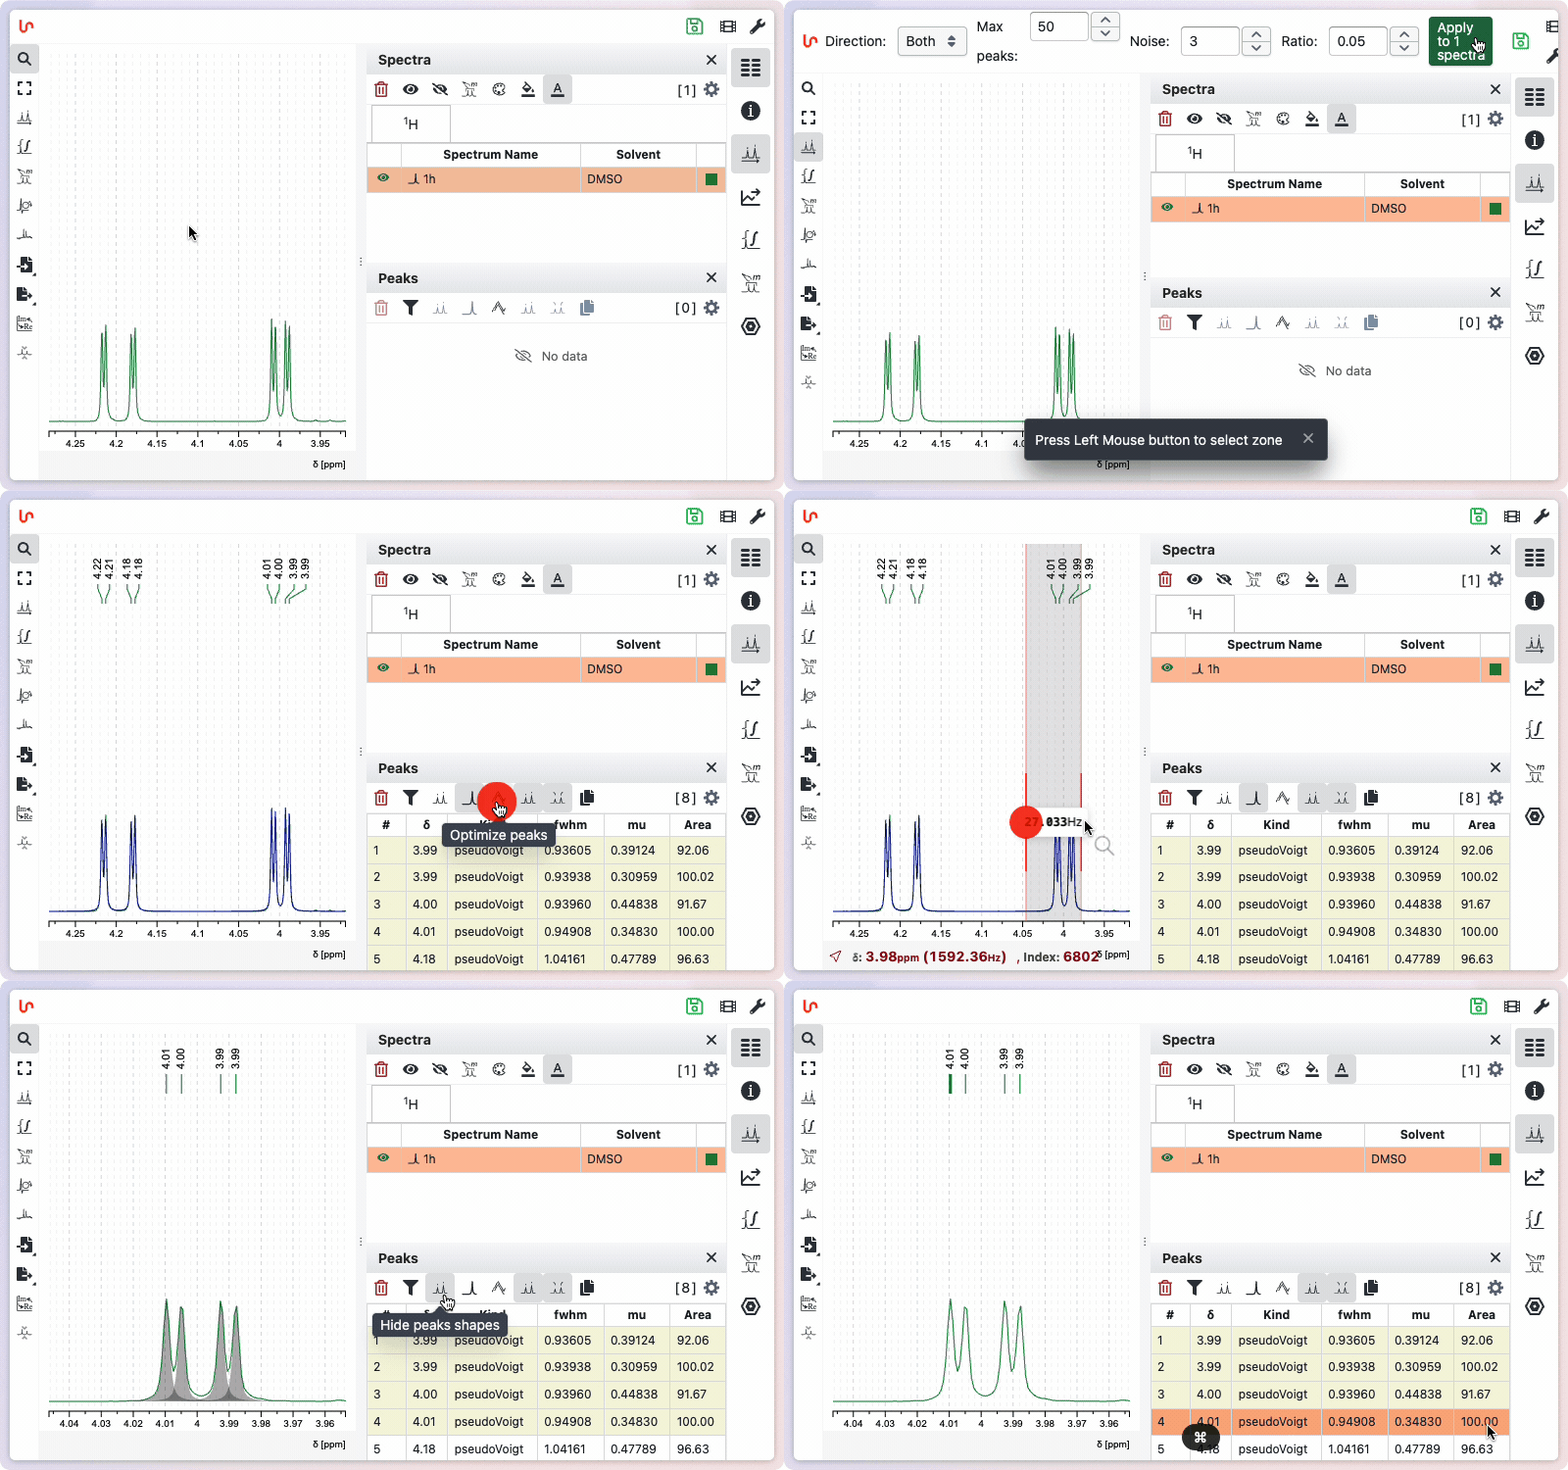
Three toolbar buttons drive this analysis. Click Optimize peaks to fit the peak shapes to the experimental data. The fit runs on every peak of the spectrum in a single step, so there is no need to zoom in first or to optimize region by region. Two display toggles then let you inspect the result:
- Peaks sum — the reconstructed trace (blue) obtained by summing all fitted peaks, overlaid on the experimental spectrum.
- Peaks shapes — the individual fitted peak shapes.
Comparing the reconstructed trace with the experimental spectrum shows how well the chosen shapes and the fitted values reproduce the real signals.
Fitted values
Once the optimization has run, each row of the Peaks panel carries the parameters of its fitted shape:
| Column | Meaning |
|---|---|
| Kind | The shape used for the fit — Gaussian, Lorentzian, or pseudo-Voigt |
| fwhm | Full width at half maximum, the width of the fitted peak |
| mu | Gaussian/Lorentzian mixing of the pseudo-Voigt shape: 1 is purely Gaussian, 0 purely Lorentzian |
| Area | The area of the fitted shape |
Because the area is computed from the fitted shape rather than from the raw trace, overlapping peaks no longer share their intensity the way a plain integral does — each one is attributed the area of its own contribution. Use Copy as TSV to export the whole table.
Remove Peaks
- Delete all peaks — click the recycle-bin icon at the top left of the Peaks panel and confirm.
- Delete a single peak — press the recycle-bin icon at the end of that peak's row in the list.